异常栈信息stack trace应该怎么用
本文详细总结了stack trace的各个部分的含义和使用方法,同时深入介绍了一些与异常相关的函数和最佳实践。
参考资料
- What’s a Java Stack Trace?
- Understanding and Leveraging the Java Stack Trace
- 如何看异常堆栈信息
- Java Stack Trace: How to Read and Understand to Debug Code
- Creating and reading stacktraces
- Understanding Exception Stack Trace in Java with Code Examples
Call Stack 函数调用栈 与 stack trace
The Stack, more accurately called the runtime or call stack, is a set of stack frames a program creates as it executes, organized in a stack data structure.
函数调用栈是一个以栈的形式保存从程序开始到运行当时调用的所有函数栈的结构。
Simply put, a stack trace is a representation of a call stack at a certain point in time, with each element representing a method invocation. The stack trace contains all invocations from the start of a thread until the point it’s generated. This is usually a position at which an exception takes place.
Stack trace 则是call stack的一种展示形式,打印出函数的名字与相关代码行。
示例:
1 | public class StackTrace { |
1 | java.lang.Exception: Stack trace |
栈信息从上往下读,最上面的是最后调用的函数,main调用a,a调用b,b调用c,c调用d,d调用dumpStack,这个函数输出以上信息。
A Java stack trace is a snapshot of a moment in time. You can see where your application was and how it got there. That’s valuable insight that you can use a few different ways.
Java Exception
Stack traces and exceptions are often associated with each other. When you see a Java application throw an exception, you usually see a stack trace logged with it. This is because of how exceptions work.
When Java code throws an exception, the runtime looks up the stack for a method that has a handler that can process it. If it finds one, it passes the exception to it. If it doesn’t, the program exits. So exceptions and the call stack are linked directly. Understanding this relationship will help you figure out why your code threw an exception.
Java Exception机制通常是和call stack函数调用栈联系在一起的。当某个函数抛出了一个异常,JVM会查看调用栈,看哪个函数可以处理这个异常(有catch),若找到则把异常传过去,若没有则终止程序。
捕捉到异常后可以执行不同的操作,一个简单的选择是直接输出这个异常的信息:
1 | try { |
若没有能够处理这个异常的函数,异常会被JVM接管,JVM会输出它抛出地的函数调用栈信息:
1 | Exception in thread "main" java.lang.NullPointerException |
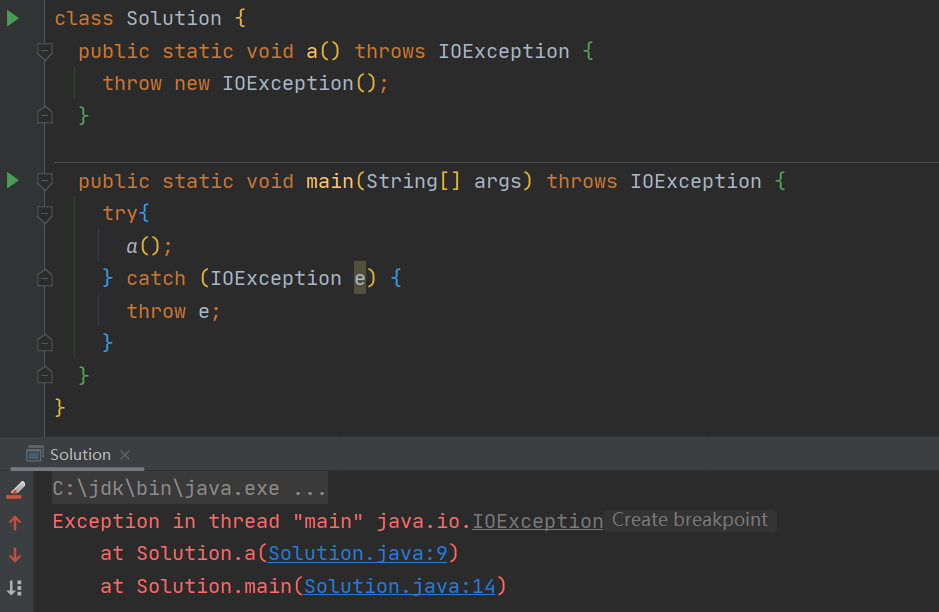
BUT 输出了这个信息不代表这个异常就一定没有被处理catch,一种情况是catch了以后又抛出了:
另一种情况是我们自己处理的时候输出了这个信息,只需要调用异常的printStackTrace()方法即可:
1 | try { |
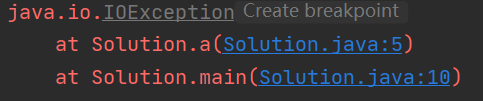
即使捕捉异常的操作是在main中执行的,它仍会打印出抛出地的调用栈信息,这有利于我们找到异常的源头。
这两种情况打印的内容有些不同:没有处理而终止的异常打印时开头多了一行内容:
1 | Exception in thread "main" |
stack trace各部分具体介绍
原文:参考资料4
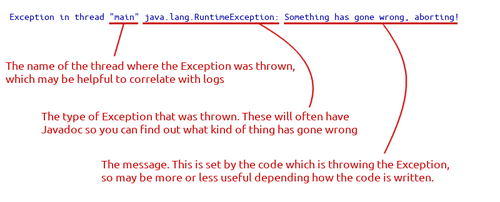
The first line tells us the details of the Exception:
This is a good start. Line 2 shows what code was running when that happened:
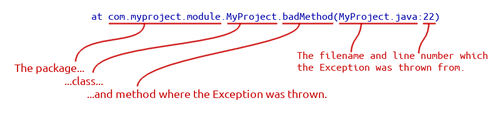
That helps us narrow down the problem, but what part of the code called badMethod? The answer is on the next line down, which can be read in the exact same way. And how did we get there? Look on the next line. And so on, until you get to the last line, which is the main method of the application. Reading the stack trace from bottom to top you can trace the exact path from the beginning of your code, right to the Exception.
将stack trace记录在log中而不是打印在控制台
使用Log4j或者Logback时,可以通过error函数保存异常的调用栈信息:
1 | logger.error(“Something bad happened:”, e); |
日志中的内容将会是:
1 | Something bad happened: |
深入stack trace
StackTraceElement class
这个类的每一个实例代表了stack trace中的一个元素。
API:
- getClassName – returns the fully qualified name of the class containing the method invocation
- getMethodName – returns the name of the method containing the method invocation
- getFileName – returns the name of the source file associated with the class containing the method invocation
- getLineNumber – returns the line number of the source line containing the execution point
Thread class
我们还可以通过调用Thread实例的getStackTrace()方法从线程得到了其stack trace。这个方法返回一个包含StackTraceElement实例的数组。
示例:
1 | public StackTraceElement[] methodA() { |
1 |
|
stackTrace[0]是getStackTrace这个方法本身的调用。
Throwable class
除了可以对Exception e进行打印stack trace的操作(printStackTrace函数),我们还可以通过getStackTrace函数获得与Thread中相同的一个StackTraceElement数组:
1 | public StackTraceElement[] methodC() { |
1 |
|
打印异常堆栈信息的函数 printStackTrace
printStackTrace:
1 | private void printStackTrace(PrintStreamOrWriter s) { |
printStackTrace内部调用printEnclosedStackTrace:
1 | /** |
信息中的… n more是怎么来的
原文:参考资料3
示例:
1 | public class TestEx { |
调试输出:
1 | Connected to the target VM, address: '127.0.0.1:57353', transport: 'socket' |
printEnclosedStackTrace函数其实是一个回调输出堆栈的过程。隐藏部分堆栈,是为了提高性能,省略一些不必要的输出,输出的内容越多,io耗时越慢。
The trace ends with an “… N more” which indicates that the last N frames are the same as for the previous exception.
其实“… n more”的部分是重复的堆栈部分。我们分析一下上面这个函数“printEnclosedStackTrace”,翻译为“打印封闭堆栈跟踪信息”,“封闭”暂且可以理解为“完整的”,这个函数有两个比较重要的变量,分别是“enclosingTrace”和“trace ”,这两个参数是什么关系呢?其实可以简单理解为“enclosingTrace”是“trace ”的父级堆栈,函数printEnclosedStackTrace中的while循环,就是为倒序找出“enclosingTrace”和“trace ”中从哪一个栈帧开始就不一样了,即“enclosingTrace”和“trace ”是有一部分是一样的(从数组后面倒回来),就是为了算出有多少个栈帧信息是重复可以隐藏的,相同的栈帧就不用重复输出了。
每个异常都输出一个完整的堆栈信息的话,都是从main函数开始,到当前的函数的所有函数调用的栈帧信息,里面函数的调用栈帧信息都会包括外层的函数调用栈帧信息,所以都输出的话,很多都是重复的,为了提高效率,减少io以及输出的内容太多又杂乱,所以jvm以“… n more”的方式隐藏了重复的部分。
当然,如果想不隐藏,可以重写java.lang.Throwable#printEnclosedStackTrace,去掉while部分,就可以看到每个异常的完整堆栈信息了,可以参考https://blog.csdn.net/michaelehome/article/details/79484722来验证。
Exception chaining:cause
工程中的最佳实践:捕捉并抛出一个更加贴合实际的Exception
原文:参考资料4、6
Let’s say we are working on a big project that deals with fictional FooBars, and our code is going to be used by others. We might decide to catch the ArithmeticException from Fraction and re-throw it as something project-specific, which looks like this:
1 | try { |
Catching the ArithmeticException and rethrowing it has a few benefits:
- Our users are shielded from having to care about the
ArithmeticException- giving us flexibility to change how commons-lang is used. - More context can be added, eg stating that it’s the number of FooBars that is causing the problem.
- It can make stack traces easier to read, too, as we’ll see below.
It isn’t necessary to catch-and-rethrow on every Exception, but where there seems to be a jump in the layers of your code, like calling into a library, it often makes sense.
注意到MyProjectFooBarException的构造器有两个参数,第二个就是cause,用来指明产生此异常的根异常。
Every Exception in Java has a cause field, and when doing a catch-and-rethrow like this then you should always set that to help people debug errors.
设置了cause后stack trace变成了这样:
1 | Exception in thread "main" com.myproject.module.MyProjectFooBarException: The number of FooBars cannot be zero |
多了一行Caused by:和cause的栈信息。需要注意的是此时若要查看异常根源,需要找到最后的caused by后面的异常的第一个方法。
The “Caused by:” is only included in the output when the primary exception’s
causeis notnull). Exceptions can be chained indefinitely, and in that case the stacktrace can have multiple “Caused by:” traces.
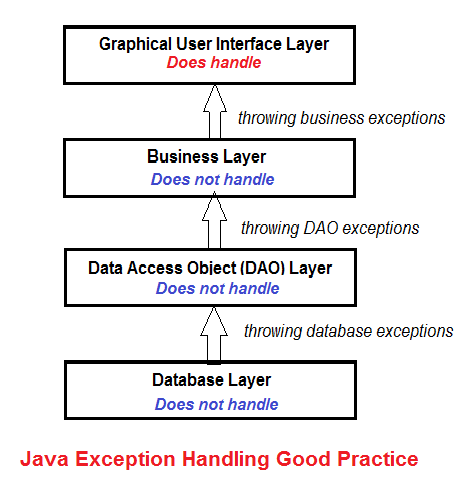
SO, don’t handle exceptions in the intermediate layers, because code in the middle layers is often used by code in the higher layers. It’s responsibility of the code in the top-most layer to handle the exceptions. The top-most layer is typically the user interface such as command-line console, window or webpage. And typically we handle exceptions by showing a warning/error message to the user.
This good practice is illustrated by the following picture:

stack trace中类、方法名的表示的特殊情况
The class and method names in the stack frames are the internal names for the classes and methods. You will need to recognize the following unusual cases:
- A nested or inner class will look like “OuterClass$InnerClass”.
- An anonymous inner class will look like “OuterClass$1”, “OuterClass$2”, etcetera.
- When code in a constructor, instance field initializer or an instance initializer block is being executed, the method name will be “”.
- When code in a static field initializer or static initializer block is being executed, the method name will be “”.
将 stack trace 转为String
有时候我们需要将栈信息转换为String以便后面的操作,通常的做法是 create a temporary OutputStream or Writer that writes to an in-memory buffer and pass that to the printStackTrace(...).
1 | /** |
Apache Commons 和 Guava 都提供有进行这个操作的工具方法。
1 | org.apache.commons.lang.exception.ExceptionUtils.getStackTrace(Throwable) |